|
Mixing and mastering music is a complicated art. There are many factors you have to take into account and pay attention to. One thing that can be easily overlooked is the fact that different speakers produce sound differently. The way a track sounds on the headphones or speakers in your studio may not be the way it sounds if you play it in your car.
Here's some things to keep in mind when mixing your track.
When you mix and master a track, you should try to listen to it on as many different speakers as possible. Play it on headphones, computer speakers, earbuds, cellphone speakers, car speakers, and any other speakers which the track might be played on. You don't want your track to sound spot-on in the studio, only to release it and then later discover it sounds terrible on car speakers.
Big name, professional producers often produce separate masters of the same track for specific methods of playback. They will make a radio master which is specifically mastered to sound best on the radio. A CD master is optimized for CD players. Internet mastering is for tracks being uploaded to the internet. You don't have to go this far with it, but you should always test a new track on as many speakers as possible before you release it. Think about where and how your listeners are most likely to listen to your track.
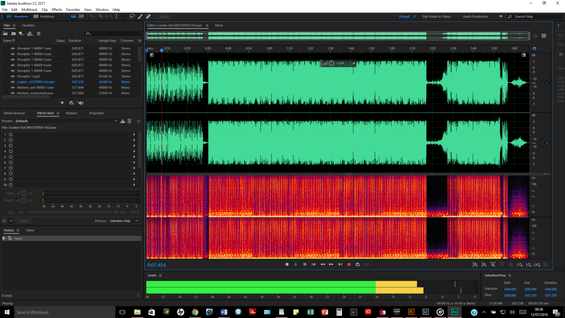
When in doubt, the best thing to do is play it safe. Take it easy on the bass especially. Bass-boosting a track should only be done if you are experienced with audio engineering. A bass-boosted track that sounds good on headphones might be an unintelligible roar on car speaker. The primary release track should be balanced across the board. Many audio software programs will offer a spectral analysis which you can use to visualize your track's frequency data and dynamic range across frequencies. This is called a spectrogram. It is similar to a waveform, except spectrograms show frequency intensity rather than decibels. This is great for seeing which frequencies may be too hot. You can see an example of a spectrogram in the picture below. The spectrogram is show directly below the green waveform.
You will need to learn how to read this information to make sense of spectrogram data, but it's fairly straight-forward to understand. The "hotter" areas of the graph appear, the greater the intensity of that frequency. It's helpful to learn a bit more about the data to fully understand it. Once you do understand the graph and how to use it, it's very helpful in your projects.
If you are working on a new track and need an instrumental beat that you can use commercially, check out our royalty-free beats in our store. We offer affordable beats with no complicated licenses or contracts. Your purchase is your license.
We also have some free beats available for commercial use under the Creative Commons.
Remember, whether you're the artist or just the engineer, once your name is on something, it's on there for life. Listening to a track on a bunch of different speakers may seem like a lot of extra work, but it's well worth it in the end. You'll be able to release your track knowing that it regardless of how your fans listen to it, it is going to sound great!
 RSS Feed RSS Feed
0 Comments
Leave a Reply. |
Quick Browsing |
ShadowCast Offers |
ShadowCast ResourcesVertical Divider
|
ShadowCast ShowcaseVertical Divider
|
© 2024 ShadowCast Productions and Talent Studios. All Rights Reserved except where otherwise stated.


